
How Do Peptides Work? The Biochemistry Behind Research Compounds
Right now, your body is awash in peptides. The insulin
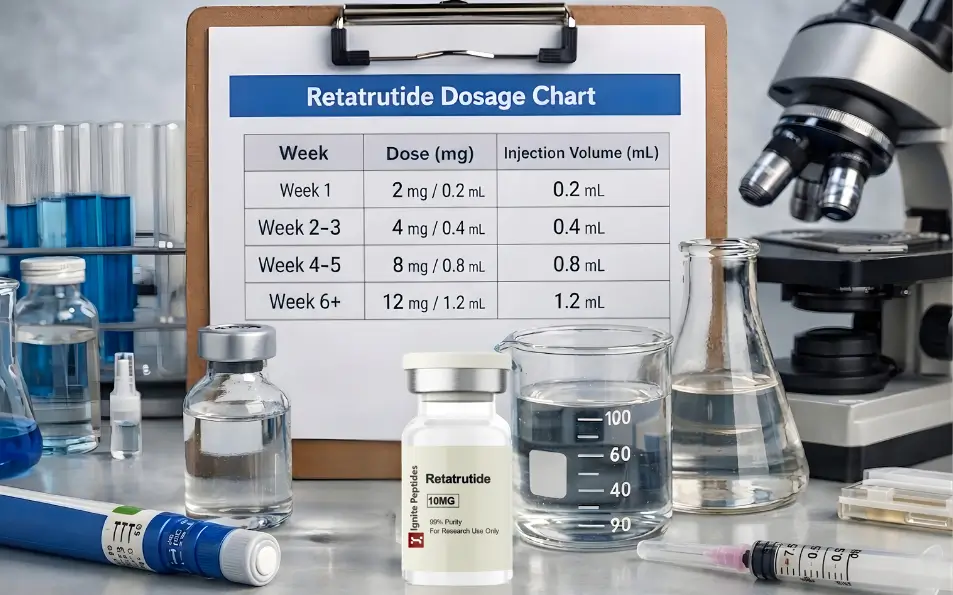
A Retatrutide dosage chart is used in research settings to track dosing levels and convert milligram values to injection volumes. The chart also supports consistent monitoring during dose escalation phases.
In most study protocols, the Retatrutide dosage chart is reviewed before each scheduled administration. This step helps verify the correct dose and injection volume.
A weekly review is also common during titration periods. Weekly checks help confirm that dosing follows the intended schedule and that no calculation errors occur.
Periodic protocol reviews, often conducted monthly, may also occur. These reviews allow investigators to assess dosing trends, research outcomes, and tolerability observations.
Summary:
In research environments, a Retatrutide dosage is typically checked before each administration and reviewed regularly during weekly monitoring cycles.
A Retatrutide dosage chart is a reference tool used in research environments to organize dosing information. It outlines specific dose levels and the corresponding injection volumes required for administration.
The chart commonly includes milligram (mg) values and their equivalent millilitre (ml) volumes. These conversions help maintain consistency when preparing injections from reconstituted solutions. Accurate conversions are important because small variations in volume may influence experimental outcomes.
Retatrutide research protocols often involve gradual dose escalation. For this reason, dosage charts typically display multiple dosing stages. Each stage reflects a planned increase in dose during the study period.
In addition to conversion values, a Retatrutide dosage may also include:
Researchers frequently use the chart as a verification reference before preparing each injection. This helps ensure that the intended dose aligns with the experimental protocol.
Within laboratory documentation systems, the Retatrutide dosage chart also serves as a record-keeping tool. It allows investigators to track dosing patterns across the research timeline.
In research settings, the Retatrutide dosage chart is more than a simple reference for dose values. Regular verification of the chart ensures accuracy, supports adherence to titration protocols, and allows proper monitoring of experimental outcomes. Consistent chart reviews also help maintain reliable data for reporting and reproducibility in studies.
Verifying the Retatrutide dosage chart before each administration is critical. Accurate chart checks help prevent dosing errors that could affect study outcomes.
Regular chart verification supports consistent dose escalation. Retatrutide studies typically follow a structured titration schedule. Confirming the correct dose at each stage ensures the protocol is strictly followed.
Chart checks allow researchers to track physiological and metabolic responses alongside dose levels. This information is essential for evaluating efficacy and tolerability during the study.
Dosage chart reviews contribute to accurate and traceable records. Consistent documentation is crucial for reproducibility and reliable reporting in research publications.
Summary:
Verifying a Retatrutide dosage chart ensures dosing accuracy, adherence to protocol, proper monitoring of experimental outcomes, and integrity of research data.
In research protocols, the Retatrutide dosage chart is reviewed at defined intervals to ensure dosing accuracy, protocol adherence, and reliable data collection. Regular checks reduce the risk of dosing errors and support the integrity of study outcomes.
| Timeframe | What to Check |
| Before each injection | Verify the correct dose and injection volume. Ensure that mg-to-ml conversions are accurate and match the planned administration. |
| Weekly | Compare the administered doses with the scheduled titration plan. Assess any deviations, cumulative dosing, or trends in experimental responses. |
| Monthly | Conduct a comprehensive review of dosing patterns, protocol compliance, and observed outcomes. This assessment may include evaluating tolerability, side effects, and alignment with study objectives. |
Pro Tip:
Marking each administration on the dosage chart can prevent missed or repeated doses. Consistent record-keeping not only minimises errors but also provides a clear reference for analysing dosing trends and study results.
In research studies, accurately converting mg to ml is critical when preparing Retatrutide injections. Even small errors in volume can affect experimental outcomes and data reliability.
A Retatrutide dosage calculator can simplify this process. By entering the intended dose and vial concentration, the calculator provides the precise injection volume. This minimises calculation errors and ensures that the administered dose aligns with the study protocol.
For a full explanation of how the calculation works including the mg to mcg to mL conversion steps see the retatrutide dosing calculator guide.
Researchers often use the calculator alongside the Retatrutide dosage chart. The chart shows scheduled doses, while the calculator confirms injection volumes. Together, they enhance accuracy and consistency across multiple administrations.
In research protocols, there are specific circumstances where additional verification of the Retatrutide dosage chart is necessary. Careful rechecks help maintain dosing accuracy, support adherence to titration schedules, and ensure reliable experimental outcomes.
| Situation | Action Required |
| Dose increase | Check the chart and prepare the correct volume; ensure alignment with the titration plan |
| Side effects observed | Review dosing, monitor subjects, and determine if adjustments are needed |
| New vial or concentration | Recalculate mg-to-ml and verify injection volume against the chart |
| Record discrepancies | Compare the chart with the administration logs and correct inconsistencies |
| Extended study interval | Reassess cumulative dosing trends and ensure protocol adherence |
Summary:
Rechecking the Retatrutide dosage chart under these conditions ensures accurate dosing, adherence to titration protocols, proper monitoring of responses, and maintenance of reliable research data.
Accurate tracking of Retatrutide doses is essential in research protocols. Proper documentation supports data integrity, dosing consistency, and protocol adherence.
| Practice | Benefit |
| Accessible dosage chart | Reduces preparation errors and increases efficiency |
| Injection logging | Maintains accurate records for analysis and reproducibility |
| Conversion verification | Minimises dosing mistakes and ensures protocol compliance |
| Calculator usage | Confirms correct injection volumes and supports safe escalation |
| Outcome monitoring | Correlates dose with physiological or metabolic responses |
Summary:
Implementing these tracking practices ensures precise dosing, reliable data collection, and adherence to research protocols, while also facilitating accurate analysis of Retatrutide effects.
Even in controlled research settings, errors can occur when using a Retatrutide dosage chart. These mistakes may affect dosing accuracy, protocol adherence, and overall data reliability. Recognizing common errors helps maintain consistent and precise administration.
Estimating doses instead of verifying the chart can lead to underdosing or overdosing. All calculations should be confirmed against the dosage chart or a validated calculator.
Misreading milligram and millilitre values is a common source of error, especially when vial concentrations differ. Accurate mg-to-ml conversions are essential.
Failing to check the dosage chart before each administration increases the risk of incorrect dosing. This is particularly critical during dose escalation or titration phases.
Not logging administered doses compromises data integrity. Maintaining updated records ensures reproducibility and adherence to the research protocol.
Research studies usually start with a low dose. For Retatrutide, the starting dose is often 1 mg per week. Exact doses may vary depending on the study design. Adjustments are made based on safety and tolerability.
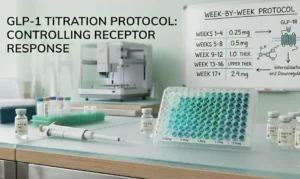
Titration schedules are usually in clinical study protocols. Peer-reviewed publications may include dose escalation tables. Clinical trial registries can also provide examples.
Dose increases are gradual. Weekly intervals are common. Some studies use biweekly increases. Side effects and physiological responses guide further escalation.
Yes, dosage charts vary by indication. Weight management may require higher doses. Type 2 diabetes often uses lower starting doses. Titration is slower to reduce side effects.
Maximum doses are set in study protocols. Retatrutide has been tested up to 12 mg per week. Exact maximums depend on tolerability and study design. Exceeding limits can increase side effect risk.
Charts are available in clinical trial documents and peer-reviewed publications. Online dosage calculators, like the Retatrutide dosage calculator, can confirm mg-to-ml conversions.
Mild side effects may require delaying dose increases. Severe reactions may need dose reduction or discontinuation. All adjustments should be recorded for accuracy.
Errors should be documented immediately. Subsequent doses are adjusted according to protocol rules. Verification with the chart or calculator prevents repeated mistakes.
Dosing can be individualized based on tolerability or weight response. Adjustments follow predefined escalation or de-escalation rules. Protocol consistency must be maintained.
Long-term studies require reviewing cumulative doses regularly. This ensures trends in efficacy and safety are monitored. Charts and calculations help keep total exposure within protocol limits.
The Retatrutide dosage chart is an essential tool in research and clinical studies. It ensures precise dosing, supports consistent titration, and maintains reliable data collection. Regular chart verification before each administration reduces errors and keeps studies aligned with the protocol. Monitoring trends and adjusting doses as required improves safety and strengthens reproducibility.
Using a Retatrutide dosage calculator enhances accuracy in mg-to-ml conversions. Properly documenting every dose and response allows researchers to evaluate efficacy and tolerability effectively. Careful chart management and record-keeping are key to producing reliable, high-quality research outcomes.
Right now, your body is awash in peptides. The insulin
CagriSema is Novo Nordisk’s investigational fixed-dose combination of cagrilintide 2.4

Semaglutide is one of the most studied GLP-1 receptor agonists
Introduction Designing a precise GLP-1 titration schedule is one of

At Ignite Peptides, we provide a secure and reliable way to source high-quality research peptides online. As a trusted U.S.-based peptide supplier, we focus on lab-verified products, full transparency, and consistent quality. With fast shipping and responsive support, we’re committed to advancing safe, dependable research you can trust.
This helps us maintain strict standards for regulatory compliance, researcher verification, and responsible product access.